
Project · Wi-Fi · Site survey
Map where your Wi-Fi actually is
“The Wi-Fi is bad in the corner” is a feeling; −82 dBm at 41.3110, 69.2401 is a fact. Carry an ESP32 around the site and it reports the live RSSI of the link it's actually on, drops the reading on a map, grades it Excellent/OK/WEAK and logs every dead zone with its position — a phone-watchable site survey for a few dollars.
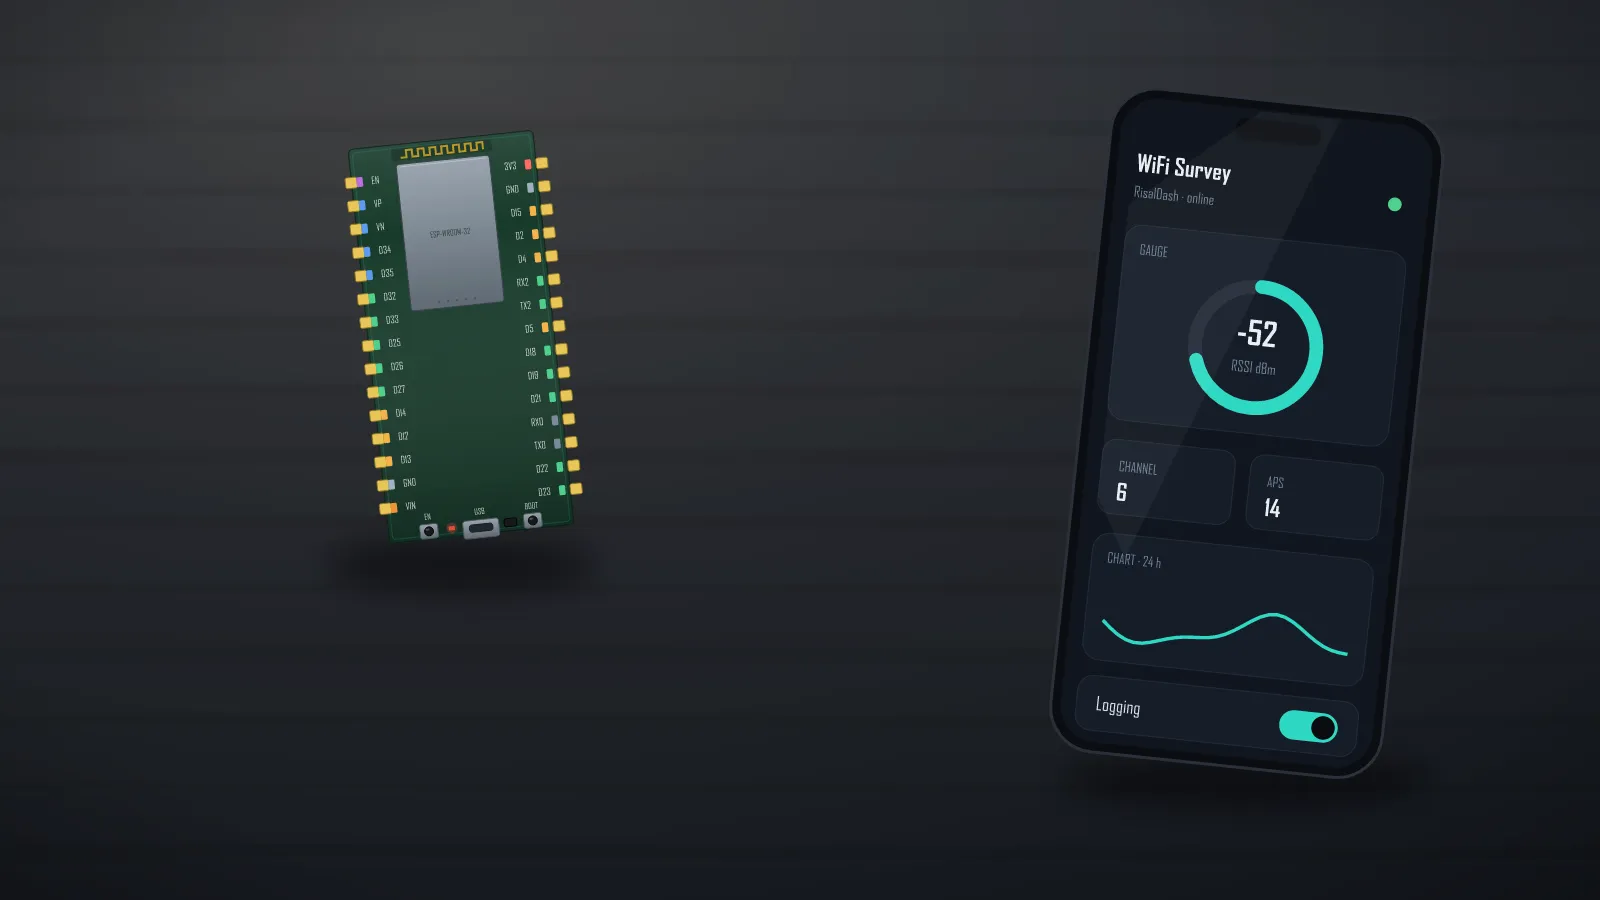
The measurement — RSSI of the link you care about
WiFi.RSSI() returns the strength of the connection the board is actually
using — which is exactly what a survey should measure, not a scan of every network in the air.
A simple mapping turns dBm into an intuitive percentage, and a three-step grade drives the badge and
the weak-zone log:
// The real measurement: this board's link to the AP, right where it stands.
long r = WiFi.RSSI();
if (r != 0 && r > -127) rssi = r;

// Map dBm to an intuitive 0-100 % (−50 dBm and better = 100, −100 dBm = 0).
quality = rssi >= -50 ? 100 : (rssi <= -100 ? 0 : 2.0f * (rssi + 100));

// Grade it, and log weak zones WITH their position:
int g = rssi > -60 ? 0 : (rssi > -75 ? 1 : 2);
if (g == 2 && grade != 2)
evlog->print("WEAK " + String((int)rssi) + " dBm @ " + String(lat, 4) + "," + String(lon, 4));| RSSI | Grade | What it means in practice |
|---|---|---|
| −30…−60 dBm | Excellent | full speed, video calls anywhere |
| −60…−75 dBm | OK | browsing fine, IoT fine |
| −75…−90 dBm | WEAK | drops, retries — move the AP or add a node |
The place — a marker for every reading
A number without a location is half a survey. Outdoors, a NEO-6M GPS pins each reading; the map widget draws the moving marker live. Indoors GPS won't help — just watch the RSSI stat and trend as you walk room to room; the weak-zone log still timestamps every dip:
dash.layout("Survey", RICON_WIFI);
dash.map("Position", &lat, &lon);              // where this reading was taken
dash.stat("RSSI", &rssi, "dBm");
dash.gauge("Quality", &quality, 0, 100, "%").variant("bar");
dash.badge("Signal", &grade).labels("Excellent", "OK", "WEAK");
dash.chart("RSSI trend", &rssi, "dBm");        // the survey trace
evlog = &dash.log("Weak zones", 5);
dash.begin(WIFI_SSID, WIFI_PASS);              // STA — we measure THIS link
The shipped example (examples/04_Templates/WifiSurvey) is honest about what's real:
RSSI is live on any board from the first boot; the GPS is
RisalFakeGPS replaying a walk route, so the whole survey works on the
bench. For real outdoor mapping, feed lat/lon from TinyGPS++ — the wiring and NMEA
parsing are in the GPS tracker build.
Survey tactics
Walk slow — RSSI is averaged and lags a second or two. Survey at desk height, not floor. Repeat the loop twice and trust the worse pass (people and doors move). And when you find the dead corner, the fix is usually the AP's position, not its power: relocate first, extend second. What the dBm numbers mean physically — antennas, walls, 2.4 vs 5 GHz — is in the wireless guide.
RSSI is live from the first boot — the GPS can stay fake until you go outside.